Monitoring dashboard
Who notices when the bot needs attention?
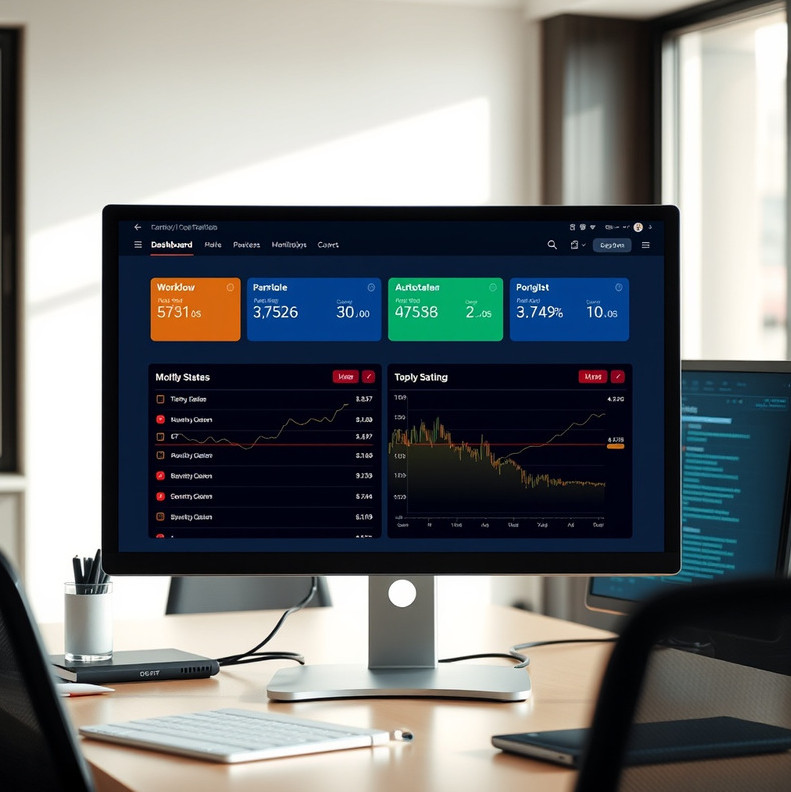
Give an operator a readable view of workflow status, order events and exceptions.
A view designed for supervision
We configure a dashboard around the events your operator needs to see: workflow state, recent signals, submitted orders, broker responses and selected alerts. A focused setup usually takes one to three weeks after event sources and recipients are agreed. You receive dashboard access, an event glossary and a handover for alert review. The dashboard reports information made available by connected systems; it cannot correct missing source data or replace a person responsible for acting on alerts.
Make each alert worth reading
Name the event
Use a label that distinguishes a paused workflow from a failed broker connection. Operators should not need to decode a generic error during a busy period.
Show the next check
Where possible, link an alert to the relevant event record and a documented response, such as checking connection status before restarting.
Choose a recipient
Assign alerts to a person or team that can respond during the hours the workflow operates. An unattended notification is not supervision.
Review the noise
Revisit alerts that fire frequently without requiring action. Too many low-value messages can obscure an event that needs attention.
Visibility has a data boundary
A dashboard can show that an order was submitted and display the response received from a broker. It cannot independently verify every event inside that broker's systems. Delayed feeds, incomplete messages and network failures can leave gaps in the view. We mark the source of each displayed status and explain when an operator should check another system directly. If you need continuous human supervision, a dashboard subscription alone does not provide it.
Events an operator may need to see
The final view depends on which events the connected systems expose.
- Workflow running, paused or stopped
- Signal time and rule identifier
- Order submission and broker response
- Data feed or connection interruption
- Control threshold reached
- Person notified and time acknowledged

Monitoring works when a person can move from an alert to the underlying event and decide what to check next. A green status light on its own says very little.
Intersparc product team
Plan a dashboard around your workflow
Tell us which events you need to supervise and who will respond when an alert arrives.
Discuss monitoring